Lupine Publishers | Journal of Otolaryngology

Abstract
The correct - optimal - fitting of speech processor determines the best result of rehabilitation. The optimal setting of most comfortable level (MCL) is achieved by accurate patient’s assessment of electrical stimuli loudness. Unfortunately, small children can’t give a reliable report about their feelings. How to determine the MCLs in every channel of children implant? Objective methods don’t give the final (optimal) comfort levels of the child’s working program. Therefore, we need subjective assessments. We tried to use a method of categorical loudness scaling (CLS). This article is a guide how to teach CI children to evaluate loudness. Good results of the CLS were observed.
Keywords: Cochlear Implant; Fitting, Categorical Loudness Scaling; C – Levels; Most Comfortable Levels (MCLS); Threshold Discomfort Levels
Introduction
The correct (optimal) fitting of the processor determines the best result of rehabilitation [1]. The optimal settings of C-levels are achieved by accurate subjective patient’s assessments of the electrical stimuli loudness. Unfortunately, young children cannot give a verbal report about their feelings. How to determine the maximum comfortable levels (MCLs) in every channel of an implant in children, i.e. to find threshold discomfort levels? For example, an objective method – reflexometry (registration of stapedial reflex) – is used for fitting of children. But the program in which MCLs are equal to the reflex threshold levels is very rarely optimal one [2].
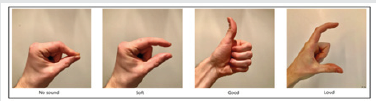
Therefore, subjective estimates of loudness are necessary. There are studies of categorical loudness scaling (CLS) in cochlear implant recipients [3] in which adult subjects participated. Results were reliable ones. What to do with children? We tried to use CLS for assessment of the loudness in cochlear implanted children. The aim of our study is how to find the equal loud C-levels in all channels and using these C-levels to create program with equal loud C-levels. Our study has a practical purpose, so we did not estimate the loudness function. We will not discuss the individual electrical levels of discomfort due to the large differences of these current values between listeners. The CLS is started when we had done reflexometry and parents selected an optimal program. We use our four pictures corresponding to categories “NO SOUND”, “SOFT”, “GOOD” and “LOUD” as a function of the electrical stimulus level (Figure 1).
Figure 1: Four categories of loudness
What reference electrical levels do we use?
Soft Levels
As we wrote earlier, at first day of fitting we approximately defined comfort levels (C-levels) which a child hears as quiet sounds [4].These stimulation levels had been recorded as C-levels in MAP3 of the first configuration. N.B. It is possible that the child did not hear a sound in some channels. Since by the time CLS starts, the child has some experience assessing the loudness of sounds, we can try to clarify these quiet C-levels. We use the first two pictures. This is a part of the CSL already. We stimulate, in our opinion, a quiet signal and “ask”. If child does not hear, we show picture “NO SOUND”. If child hears we show picture “SOFT”. Further, we reduce C-level below the threshold of hearing (2 presses on “Pg down”) and stimulate. We show squeezed fingers – “NO SOUND”. We repeat stimulation on different electrical levels involving the child in this game-study.
Loud Levels
By the time the CLS will be performed at relatively loud С-levels, we had done a reflexometry. How it is performed was described in our article [5]. N.B. In the case of absence of intraoperative ipsilateral reflex, it is impossible to exclude the presence of the contralateral reflex. We created a reflex-program with C-levels equal to the threshold levels of the reflex and recorded it as MAP2 of new configuration. It is known that different children can hear the different intensity of the sounds (from not too loud to loud) at the program where C-levels are equal to reflex threshold levels (our MAP 2). From this reflex-program we had created 3 programs and write them into the configuration. The first MAP is 3 steps lower, and 3-rd and 4-th maps are 3 and 6 steps louder correspondingly. In accordance with our instruction-explanation (“Program is optimal one if your child sometimes hears loud sounds” [6] speech therapists and parents selected optimal (working) program. It should be noted that almost all patients successfully use programs with C-levels above the reflex threshold levels by 3-6 steps (MAP3 and MAP4) [7] and even more. This is normal physiological phenomenon.
When we fit the patient without intraoperative reflex we work in accordance with the standard algorithm of fitting [8]. We gradually increase (in parallel) C-levels at all the electrodes until the parents and we’ll see that some program is loud one. Below this program is a working program (the optimal). Threshold levels are set to 10 percent of C-levels. Using this working program children respond well to all sounds and do not display negative reaction when surrounding sounds are the loud ones. Children can use a louder program in a quiet environment, but a child does not like it in a loud environment (according to parents’ comment). For the purposes of the CLS we use the test program, in which C-levels are less than levels of working program by 3 steps.
Why do we use a program less than optimal one for CLS? The child uses the optimal program in everyday life without problems, but when he will hear a sequence of long-term (300 ms) stimuli with an interval of 300 ms (SWEEP mode) on the one channel at maximal C-levels, the sensation can be unpleasant. N.B. Before CLS, it is necessary to visually assess the child’s reaction to the presentation of single and SWEEP stimuli at the C - levels of the test program - is there any negative reaction? Quite possible that child will not like the maximum C-levels of test program on some channels. C-levels in such channels must be corrected. Corrected C-levels of this test program will be used as loud sounds of the “LOUD” picture.
So. What do we have for our research?
A child hears and orients in sounds in accordance with an information of speech therapists and parents. Parents and teachers have identified a working program that the child uses without problems in all sound environments. Its C-levels are equal (very very rarely) or higher (almost all patients) than threshold levels of stapedial reflex. A child uses CI readily, in the morning the child asks to wear CI himself. A child indicates that the optimal program is the best one. (We asked parents to switch on processor at the first program –the child indicated to change the program). We know approximate loudness of some electrical levels. We know electrical levels, where the child hears quietly. We know where the child hears loudly - at C-levels of the test program. We know where the child hears well- in the area of the third quarter of the dynamic range of the audible current. The child has some experience of distinction between “SOFT” levels and “NO SOUND”. We can start the Categorical Loudness Scaling.
Methodics
How Do We Perform Categorical Loudness Scaling?
We use SWEEP stimulation, i.e. we provide a sequence of identical stimuli of the same amplitude on one channel. The duration of stimuli is 300 ms, the interval between them is 300 ms. SWEEP stimulation is started by pressing down the “Enter” button. The duration of the stimulation is determined by the duration of pressing the “Enter” key and the reaction of the child. We start CLS with a channel with a central frequency in the area of 800-1000Hz. We use categories “NO SOUND”, “SOFT”, “GOOD” and “LOUD” as a function of the electrical stimulus level. At first, we show our fig. 1 to the child. Child already has some experience in categories “NO SOUND” and SOFT”. We show signs with our fingers and explain what the volumes of the sound the child will hear in his (her) head (ear). Owing to our practice, we think that our pictures are more understandable and natural signs for description of child’s own sensation than a circle, squares, cubes etc. These signs are easier to repeat by children. Children may understand meaning of these signs from the birth.
We explain to the child that now we will stimulate, and he will hear a sound in the head (ear). We show the second picture, repeat the sign with our fingers and transmit quiet SWEEP-stimuli. We “ask” the child. If child agrees that he hears a quiet sound, we invite him to show it in the picture or with his fingers. Switching off stimulation, we squeeze fingers, show the first picture, that now there is no signal. Next, we show that we are going to increase the sound. We increase C-levels to 60% of the C-level of test program. We show the “GOOD” picture, raise our thumb and send SWEEP-stimuli. “Ask”. If child agrees, we invite him to show it in the picture or with his fingers. Switching off stimulation, we are clenching fingers, show that now there is no signal. The child agrees. Changing the electrical levels up-down we show with our fingers and on the corresponding picture how loud the signal or no signal will be heard. We invite him to show by his fingers or at appropriate picture. That’s how we perform the CLS training. After some training, a child begins to navigate in their feelings and to give real answers. When we reduce the level of stimulation the child brings own fingers closer, when we increase-move apart. Or they show the corresponding picture. He should be praised. Now we can go to the loudness estimations of the stimuli from the third quarter of the dynamic current range. When a child is assessing of the sound as “GOOD” we “ask” him if it is possible to increase the level of stimulus a little. Waiting for consent or refusal. Many children agree of our offer to slightly increase the stimulation. Then we increase C-level by 1-2 steps, stimulate and look how child displays this increase. Or by fingers, or on pictures. So, we move to the maximal C-levels of our test program where child will hear loudly i.e.to the fourth picture. Closely observe a behavior of the children during the CLS and involve them in the process!
It is curious to note that if some children show estimations of loudness not with their fingers, but with the pictures, they can show their ratings between pictures. For this reason, all four pictures must be placed in one line. Some children begin to show their estimations by the distance between palms. If the child is a contact one and cooperates with the audiologist, you can propose him to increase levels in order to gently touch the threshold discomfort levels. For this purpose, it is necessary to increase a C-levels of test program. But this is the best result. Repeated CLS measurements were done using single-electrode stimuli at a few electrode positions (sometimes all). C-levels at unmeasured electrodes were interpolated. The results were recorded. At the end of the CLS, we set equal-loud C-levels at all channels and make a program. Further, we compare these C-levels with the C-levels of working program defined by parents and teachers. We create new program with C-levels close to C-levels of working program. Since the C-levels of the created program and the working one are not the same ones, we check new program vootiue (on the child’s own ear) and create one program of 3 steps lower and 2 programs by 3 and 6 steps higher. Parents choose an optimal program in accordance with our instruction-explanation [8].
During the CLS we “communicate” with the child, “ask” and “explain”. Naturally, by signs: gestures, fingers, touching, facial expression and praise. We think that such a relationship is interesting to the child - child cooperates with the audiologist, we praise him for his work, correct mistakes, rejoices for the correct answer. Children tend to participate in this “research-game” with interest. We think that children are interested in judging the volume of sounds of different intensity and frequency, that’s why they willingly participate in the CLS.
Discussion
Children work in the CLS successfully. But loudness is a subjective evaluation. Naturally, for example, the same “LOUD” ratings of different patients will be different if they are measured in the terms of SPLs. We believe that the child himself chooses some criteria for assessing the loudness of sound and relies on it for all channels. It is quite natural for each patient to have his criterion, but we hope it is the same one for each child. Somehow it is used in repeated measurements on the different electrodes. Stable repeatable estimates are confirmation of this thesis. Every child adjusted all channels in accordance with own volume criterion. It is clear that adults also have their own criteria too, based on which they assess the loudness of the stimuli. But adult participants themselves noted difficulties in assessing the loudness of singlechannel stimuli of different spectral color. During the development of the fitting program SHCHUP [9] in which the stepped noises are used, adult patients themselves said that the estimation of the loudness of the stepped noises is easier than the loudness estimation of single-channel stimuli. Of course, children have the same difficulties. So, it is clear that the results of CLS on separate channels are not the completion of the fitting of children. The results of the detection equal loud(!) C-levels are important to configure the same equal loud levels in all channels and create a program. Despite the successful mastering of CLS by children, the last step of the fitting is the SHCHUP [9] . SHCHUP is the definition of comfortable SPLs of the stepped noises. The estimation of loudness of the stepped noises is a simpler task for experienced in CLS children too. On the base of SHCHUP’s results, we create four programs in new configuration.
The last step of fitting is the parents’ evaluation of the child’s perception of these programs in different sound environments and the definition of the optimal program in accordance with our instruction-explanation (Petrov & Tsjuk, 2015). Several hundred children (I did not count) participated in procedure of CLS, and I can surely say that the categorical loudness scaling in the fitting of cochlear implant children works successfully. We are sure that CLS is interesting game-procedure for the implanted children and useful method for an audiologist in order to fit children successfully. The CLS is a good encouraging and illustrative program for parents too. For example, we increased the level of stimuli and said mother that sound will be louder now. We stimulate and she sees that her child moves his fingers wider or moves his finger on the fig. 1 to the right. We reduce the level of stimulus and tell mother that sound will be quieter now. We stimulate and she sees that her child brings fingers closer or moves a finger on the fig. 1 to the left. At zero level, child squeezes his fingers together. So CLS is interesting and encouraging procedure for parents - mother sees the coherence of our words about changing of intensity (up or down) and the child response. Mothers are glad that her child correctly assesses the volume of sounds. This article describes General guidelines for performing of CLS. The main aim of this article is to guide how to teach the CI child to assess the loudness of sounds that is very important in the fitting process. Naturally, each child needs his own approach and this CLS, of course, is not done immediately. Speech therapists can use these pictures in their job with implanted patients and hard of hearing children too. Perhaps this method of the CLS can be patented.
Read More Lupine Publishers Otolaryngology
Journal
Articles:
https://lupine-publishers-otolaryngology.blogspot.com/